Skip to content
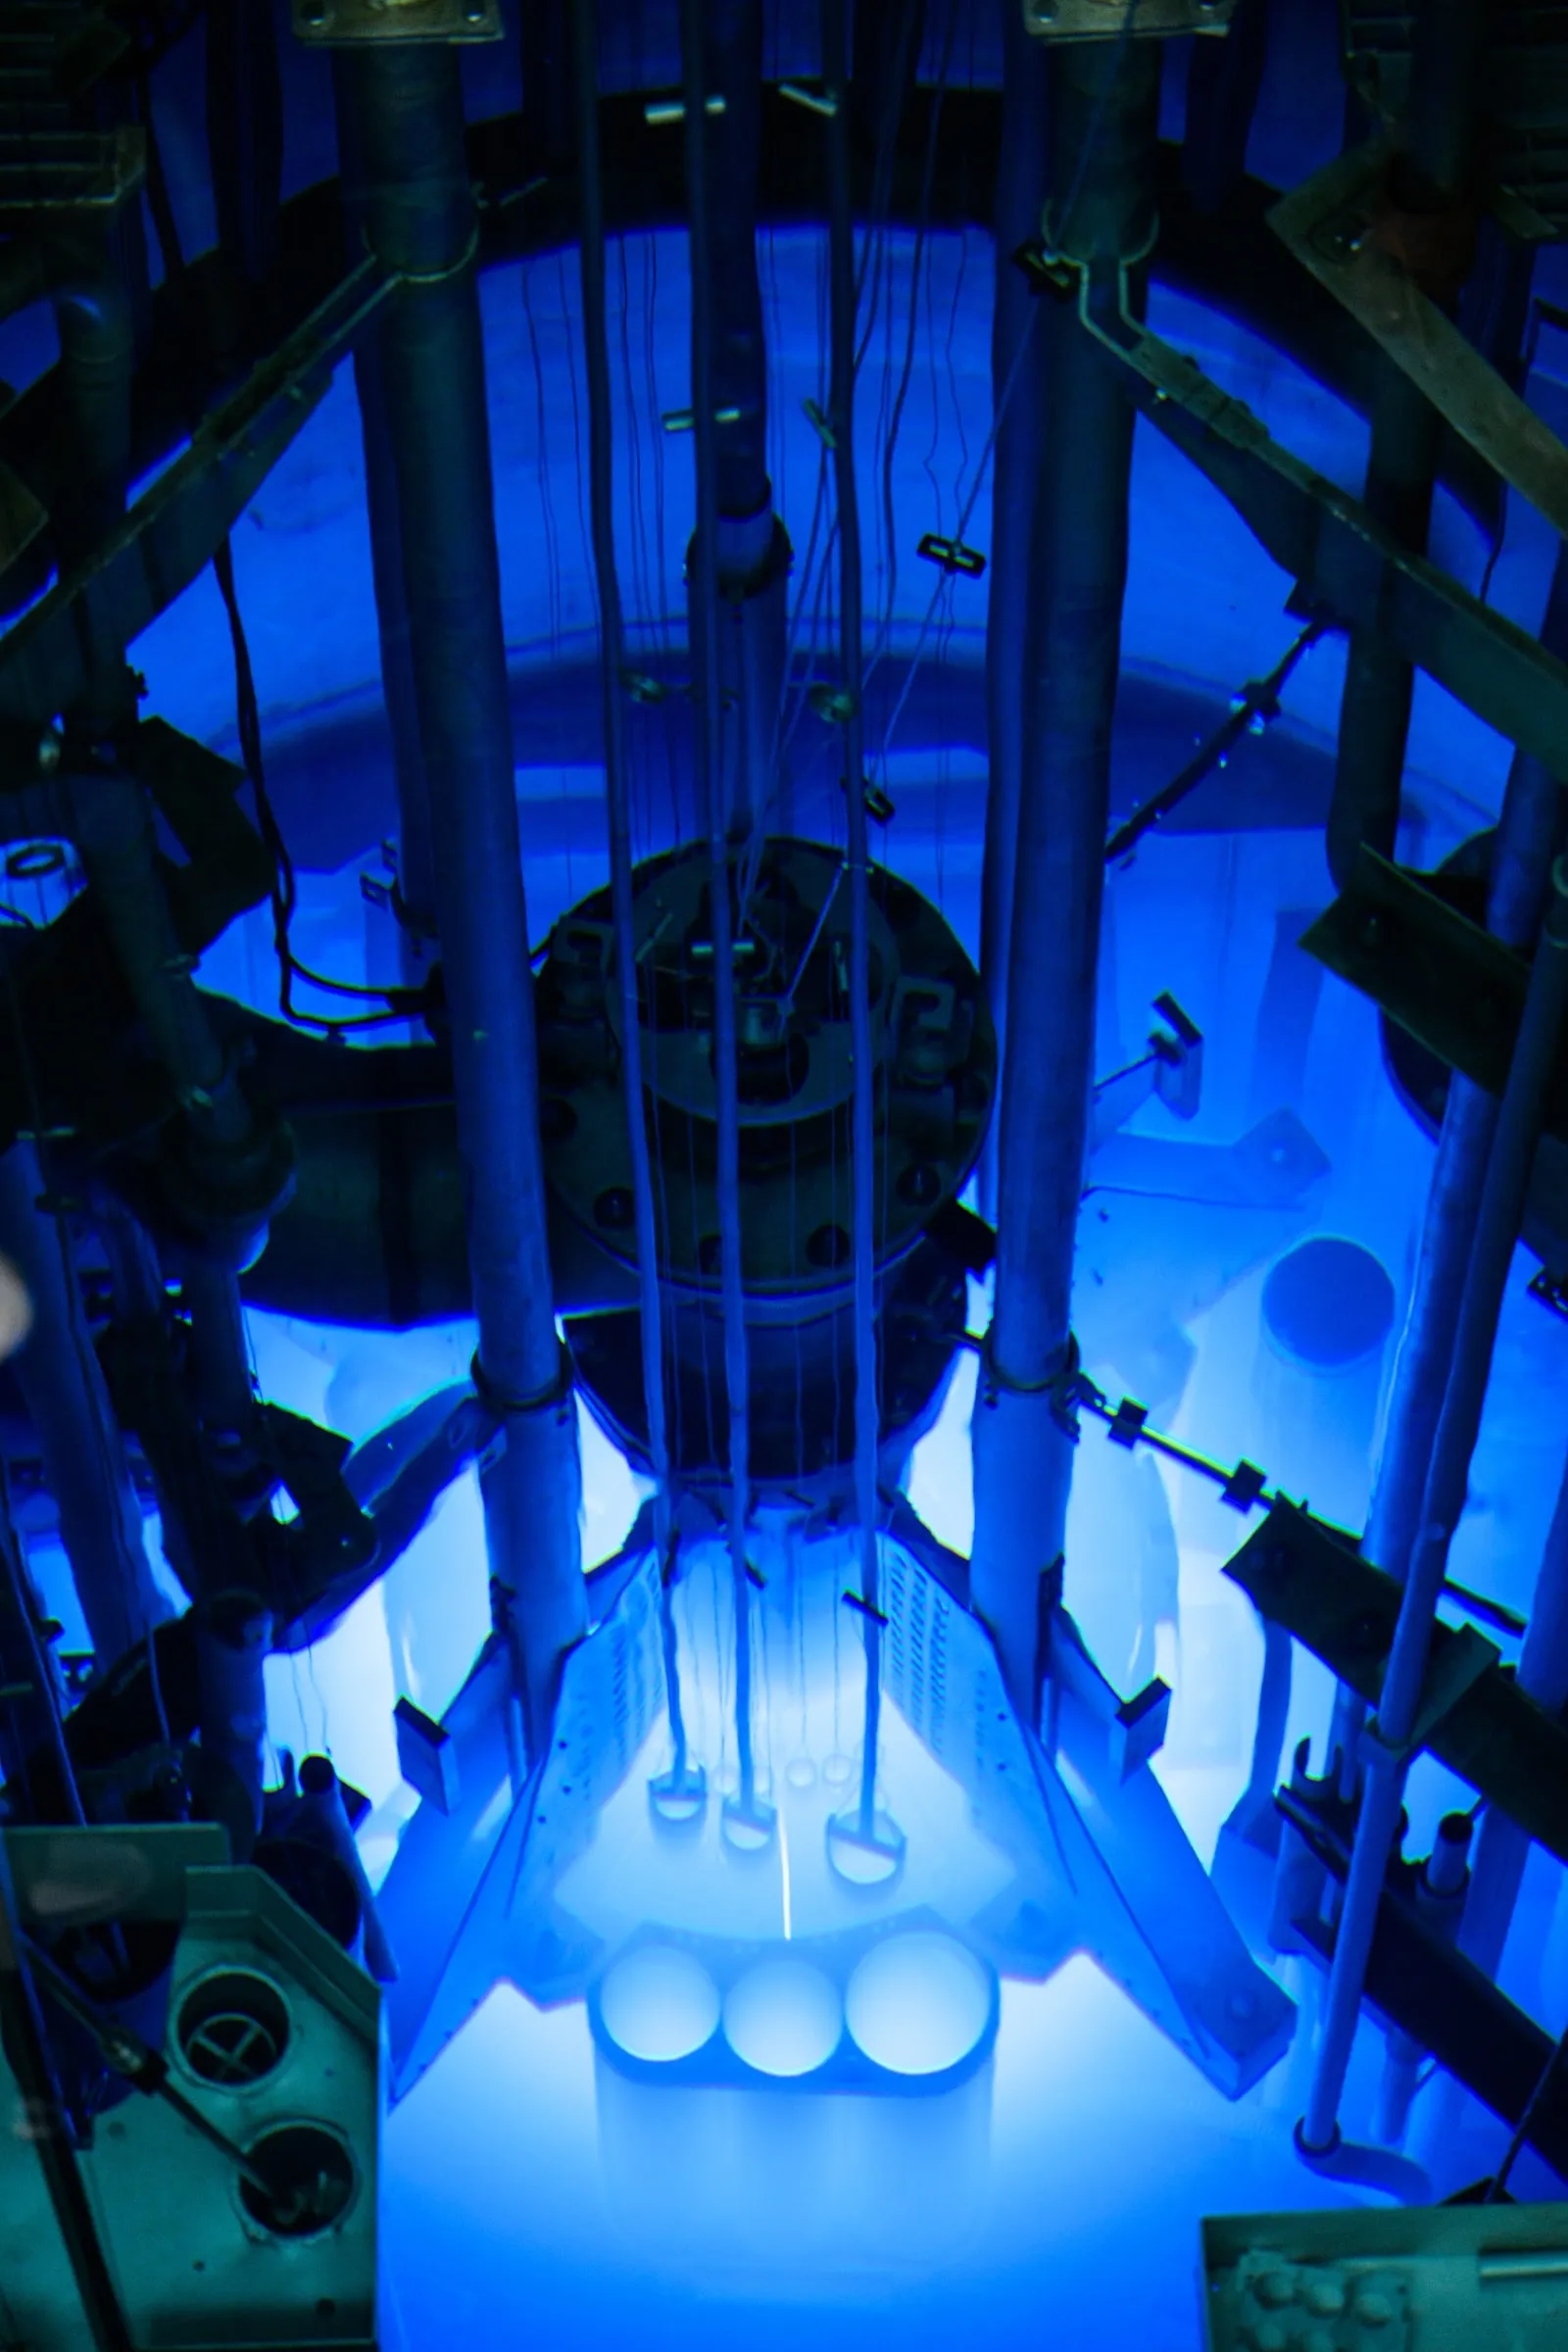
The Cherenkov-blue core of a research reactor, where medical isotopes are produced — illustrative isotope-production physics, not a FabUTech facility.

The radiolytic landscape

Every isotope is a different radiolytic problem.

The isotopes driving the radiopharmaceutical wave span a hundredfold range of half-lives and decay energies. That physics is entirely public. It sets how much peroxide each one generates in the vial, and for how long. Here is the whole landscape, side by side.

Every number below is public and sourced. Half-lives and decay modes are verified against the IAEA Live Chart of Nuclides and the NNDC; the mean-energy and radiolysis-yield inputs are drawn from the cited radiation-physics literature. The curves are modeled from that physics with DuraRad's shared radiolysis engine, the same model behind the simulator.

Comparative fingerprint

One model, ten radiolytic signatures

Each curve is the modeled hydrogen-peroxide burden an uncoated vial accumulates over storage time, run at each isotope's representative clinical activity in a common 6R vial. Two public-physics dials drive the differences. Decay energy and yield set the height; half-life sets the shape.

Comparative modeled radiolysis fingerprint across the clinical isotope rosterModeled hydrogen-peroxide accumulation in an uncoated vial over storage time for 10 clinical radioisotopes, each at its representative clinical activity in a common 6R vial. Curves are grouped by decay family; the height reflects decay energy and yield, and the point where each curve flattens marks that isotope's half-life. Modeled from measured peroxide clearance in DuraRad vials and literature radiolysis yields. Radioactive validation designed and scheduled for Q4 2026 at Washington University in St. Louis.1101001k10k1 min10 min1 h6 h1 d3 d1 wk30 dStorage time (log scale)Modeled uncoated [H₂O₂] (µM, log)Lutetium-177 — modeled uncoated peroxide at 7.4 GBqActinium-225 — modeled uncoated peroxide at 8 MBqYttrium-90 — modeled uncoated peroxide at 1.18 GBqIodine-131 — modeled uncoated peroxide at 5.55 GBqLead-212 — modeled uncoated peroxide at 175 MBqGallium-68 — modeled uncoated peroxide at 200 MBqZirconium-89 — modeled uncoated peroxide at 37 MBqCopper-64 — modeled uncoated peroxide at 148 MBqCopper-67 — modeled uncoated peroxide at 4 GBqAstatine-211 — modeled uncoated peroxide at 200 MBqGa-68At-211Pb-212Cu-64Cu-67Y-90Zr-89Lu-177I-131Ac-225

Scroll the chart

  • Alpha / high-LET Ac-225, At-211
  • Mixed chain Pb-212
  • Beta / positron Lu-177, Y-90, I-131, Ga-68, Zr-89, Cu-64, Cu-67

HeightHeight is how much peroxide the model accumulates; color groups the three decay families, whose radiolytic yield rises with LET (alpha over mixed over beta).

ShapeThe knee where each curve flattens sits at that isotope's half-life. Short-lived tracers finish on the left, long-lived therapeutics carry their burden across days on the right.

Modeled uncoated peroxide accumulation across the clinical isotope roster. Curve shapes are driven entirely by public nuclear data (half-life, decay energy, LET-dependent yield).

Modeled from measured peroxide clearance in DuraRad vials and literature radiolysis yields. Radioactive validation designed and scheduled for Q4 2026 at Washington University in St. Louis.

Model & validation detail

Pseudo-first-order H₂O₂ clearance, k = 0.107 min⁻¹ (Batch 2, 6R / 3.0 mL). Generation from literature G-values. Performance under continuous irradiation not yet validated.

The roster

Ten isotopes, therapy-first

Ordered by clinical weight: the therapeutic anchors first, then the diagnostic tracers. Each tile carries the public nuclear data behind its fingerprint. Open any one in the simulator to see DuraRad's modeled effect on that isotope.

Lu-177

Lutetium

Beta / positron

The commercial workhorse

Half-life
6.647 days
Decay mode
β⁻
Charged-particle energy per decay
0.149 MeV
G(H₂O₂) yield
0.70

Clinical usePSMA & somatostatin therapy (Pluvicto, Lutathera)

A 6.6-day half-life delivers a low-energy beta dose sustained across the entire shelf life, the profile behind documented radiochemical-purity loss in ¹⁷⁷Lu products.

View isotope profile

Ac-225

Actinium

Alpha / high-LET

The high-LET hero

Half-life
9.92 days
Decay mode
α chain
Charged-particle energy per decay
27.6 MeV
G(H₂O₂) yield
1.10

Clinical useTargeted alpha therapy (TAT)

A four-alpha decay chain packs roughly 27 MeV of high-LET energy per parent decay, the densest radiolytic track in the clinical roster.

NNDC updated the Ac-225 half-life to 9.92 d; the model curve uses the legacy 10.0 d value, a difference invisible on the illustrative fingerprint.

View isotope profile

Y-90

Yttrium

Beta / positron

The high-energy beta

Half-life
64.0 hours
Decay mode
β⁻
Charged-particle energy per decay
0.934 MeV
G(H₂O₂) yield
0.70

Clinical useRadioembolization & radionuclide therapy

A hard 0.93-MeV mean beta over a 2.7-day half-life, high energy deposited per decay across a moderate usable window.

View isotope profile

I-131

Iodine

Beta / positron

The proven therapeutic

Half-life
8.03 days
Decay mode
β⁻
Charged-particle energy per decay
0.182 MeV
G(H₂O₂) yield
0.70

Clinical useThyroid ablation & radionuclide therapy

Gigabecquerel therapy activities over an 8-day half-life make for the longest sustained beta burden in the roster.

View isotope profile

Pb-212

Lead

Mixed chain

The in-vivo alpha generator

Half-life
10.6 hours
Decay mode
β⁻ → α chain
Charged-particle energy per decay
7.69 MeV
G(H₂O₂) yield
0.98

Clinical useTargeted alpha therapy (TAT)

A beta-emitting parent feeding a high-energy alpha chain, a mixed-LET burden concentrated into a 10.6-hour half-life.

View isotope profile

Ga-68

Gallium

Beta / positron

The PET sprinter

Half-life
67.7 minutes
Decay mode
β⁺
Charged-particle energy per decay
0.738 MeV
G(H₂O₂) yield
0.70

Clinical usePET imaging (PSMA, DOTATATE)

A 68-minute half-life collapses the entire radiolytic dose into a short, intense burst before the tracer is used.

View isotope profile

Zr-89

Zirconium

Beta / positron

The immunoPET tracer

Half-life
78.4 hours
Decay mode
β⁺ / EC
Charged-particle energy per decay
0.102 MeV
G(H₂O₂) yield
0.70

Clinical useAntibody PET (immunoPET)

A 3.3-day half-life matched to antibody pharmacokinetics, a mostly electron-capture decay whose low per-decay energy is sustained across a long imaging window.

View isotope profile

Cu-64

Copper

Beta / positron

The theranostic twin

Half-life
12.7 hours
Decay mode
β⁺ / β⁻ / EC
Charged-particle energy per decay
0.124 MeV
G(H₂O₂) yield
0.70

Clinical usePET imaging & radionuclide therapy

Three competing decay branches (β⁺, β⁻, electron capture) over a 12.7-hour half-life make its charged-particle output unusually mixed.

View isotope profile

Cu-67

Copper

Beta / positron

The therapeutic twin

Half-life
61.8 hours
Decay mode
β⁻
Charged-particle energy per decay
0.141 MeV
G(H₂O₂) yield
0.70

Clinical useRadionuclide therapy

Cu-64's therapeutic twin, chemically identical: a low-energy beta sustained at gigabecquerel therapy activity over a 2.6-day half-life, and increasingly paired in the clinic.

View isotope profile

At-211

Astatine

Alpha / high-LET

The single-alpha therapeutic

Half-life
7.21 hours
Decay mode
α / EC
Charged-particle energy per decay
6.79 MeV
G(H₂O₂) yield
1.10

Clinical useTargeted alpha therapy (TAT)

A clean single-alpha decay delivered at high activity over a 7.2-hour half-life, high-LET intensity on a short clock.

View isotope profile

Data & sources

How this was verified

Half-life and decay mode are public nuclear data, verified against the sources below. The energy shown is the charged-particle energy deposited per parent decay: for single-particle beta and alpha emitters, the mean energy of the emitted particle; for the mixed positron / electron-capture emitters (Cu-64, Ga-68, Zr-89), the charged-particle energy averaged over every decay branch, including the beta-minus branch Cu-64 also carries and the electron-capture branches, which emit only low-energy Auger electrons rather than a positron, so the per-decay figure is well below any single beta or positron endpoint; for the decay chains (Ac-225, Pb-212), the summed charged-particle energy of the chain in secular equilibrium. G-values are representative LET-dependent radiolysis yields from the radiation-chemistry literature, used as model inputs, not precision constants.

See DuraRad answer any of these

The fingerprints above are the problem. The simulator shows the response: load any isotope and watch the modeled peroxide curve with a DuraRad coating against an uncoated vial.